
Maximum Drawdown
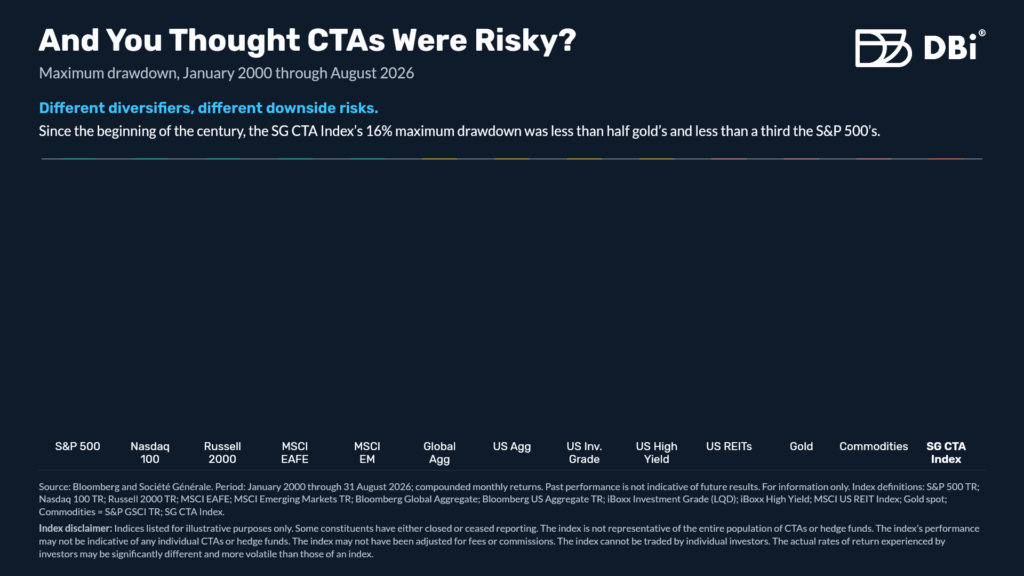
Since the SG CTA Index launched in 2000, its maximum drawdown has been smaller than that of the “safe” Bloomberg US Aggregate Bond Index. It is also less than 40% of gold’s maximum drawdown, less than a third of the S&P 500’s, and less than 20% of broad commodities. That record covers more than 25 […]
Finding the Core Within the Complexity
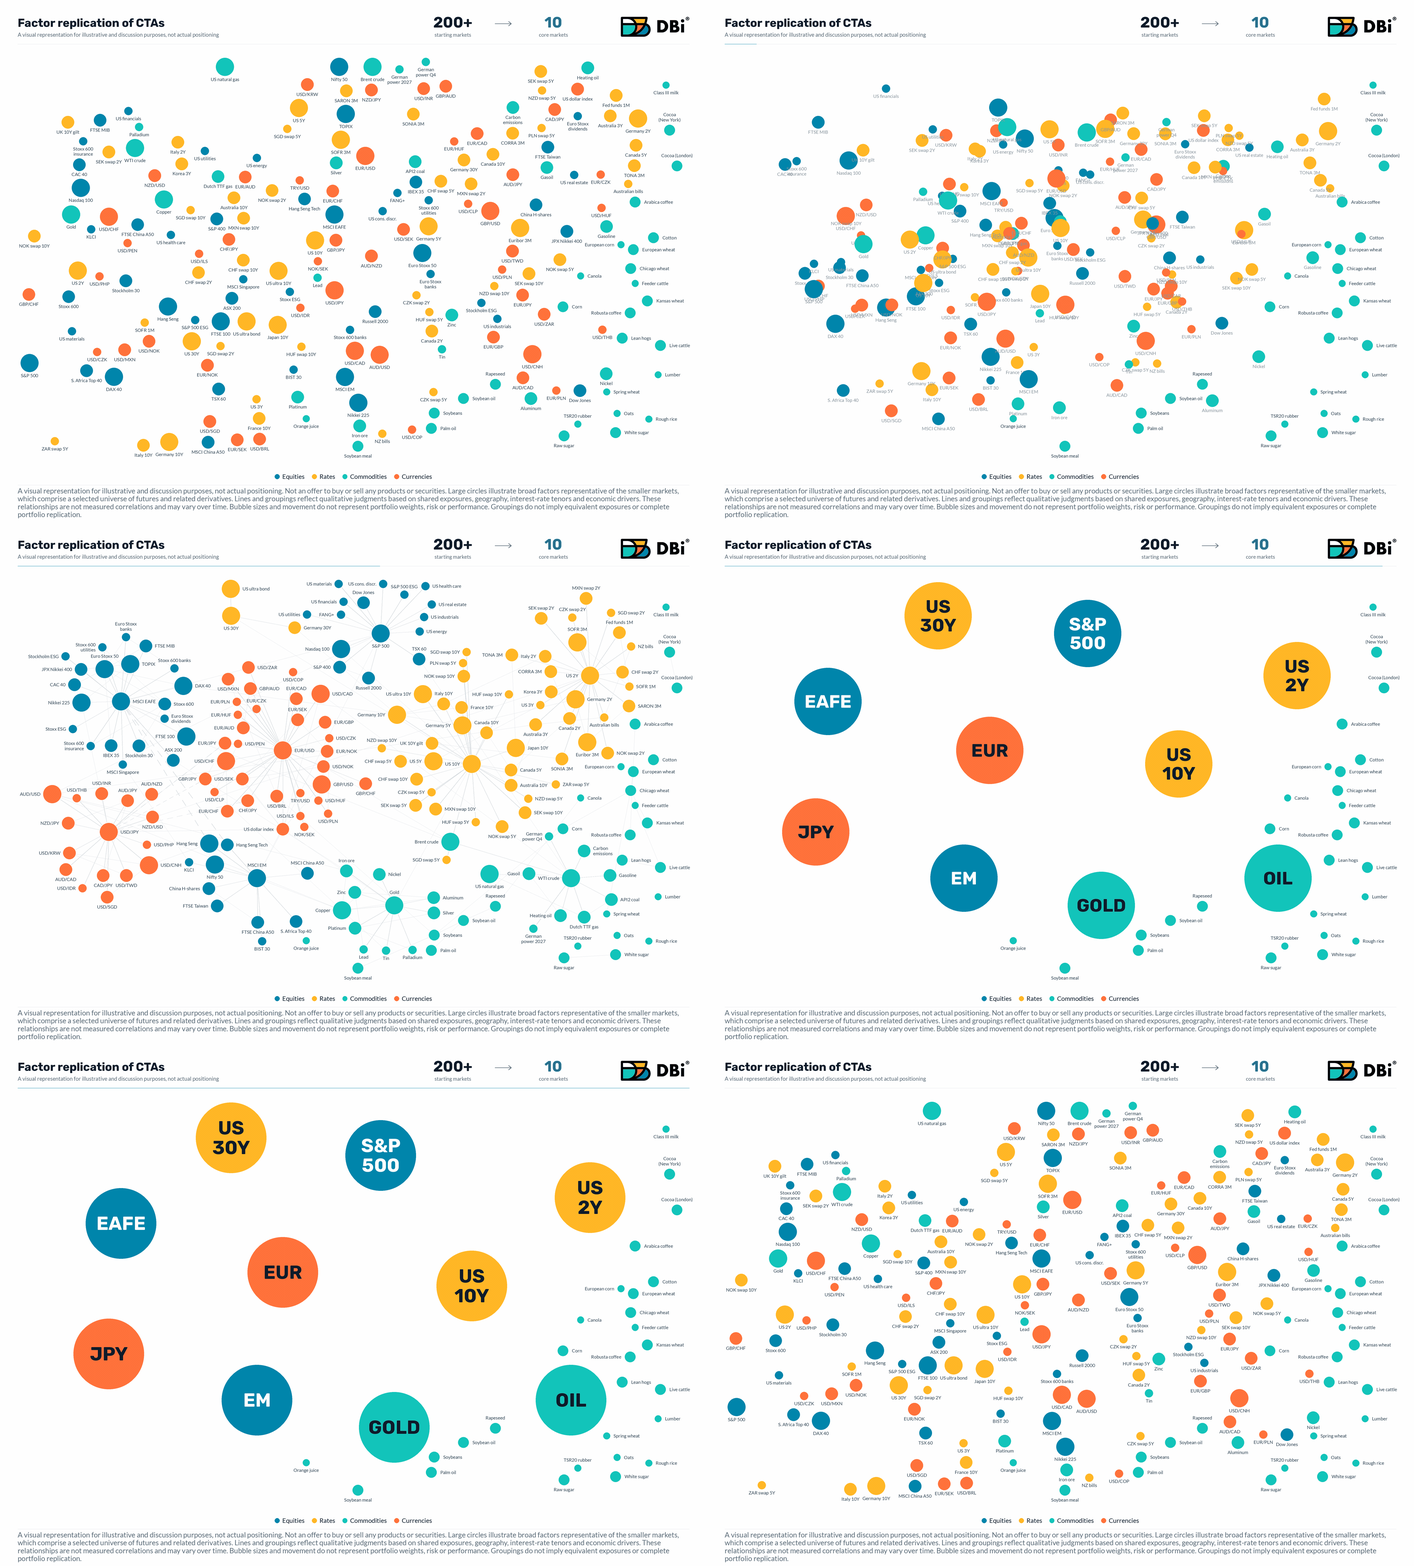
More markets don’t necessarily mean more distinct exposures. This animation groups related markets around ten representative factors, showing how a simpler framework can bring CTA complexity into focus. That is the premise of factor replication: seeking broad exposures through a focused set of markets.
CTA vs. Peers
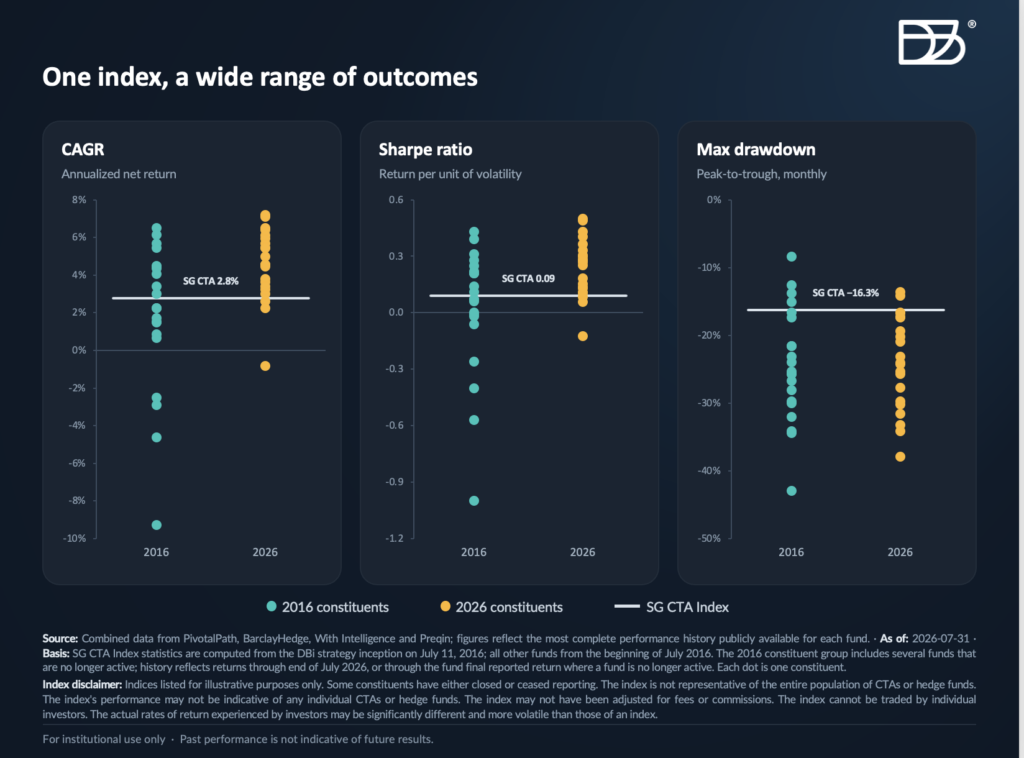
The SG CTA Index keeps its name, but its managers change yearly. We compared its 2016 and 2026 constituents, looking back at their available returns from July 2016 onward. The 2026 group looks stronger, but hindsight matters. Selecting managers based on their membership a decade later introduces selection and survivorship bias, while the 2016 roster […]
Brave New World
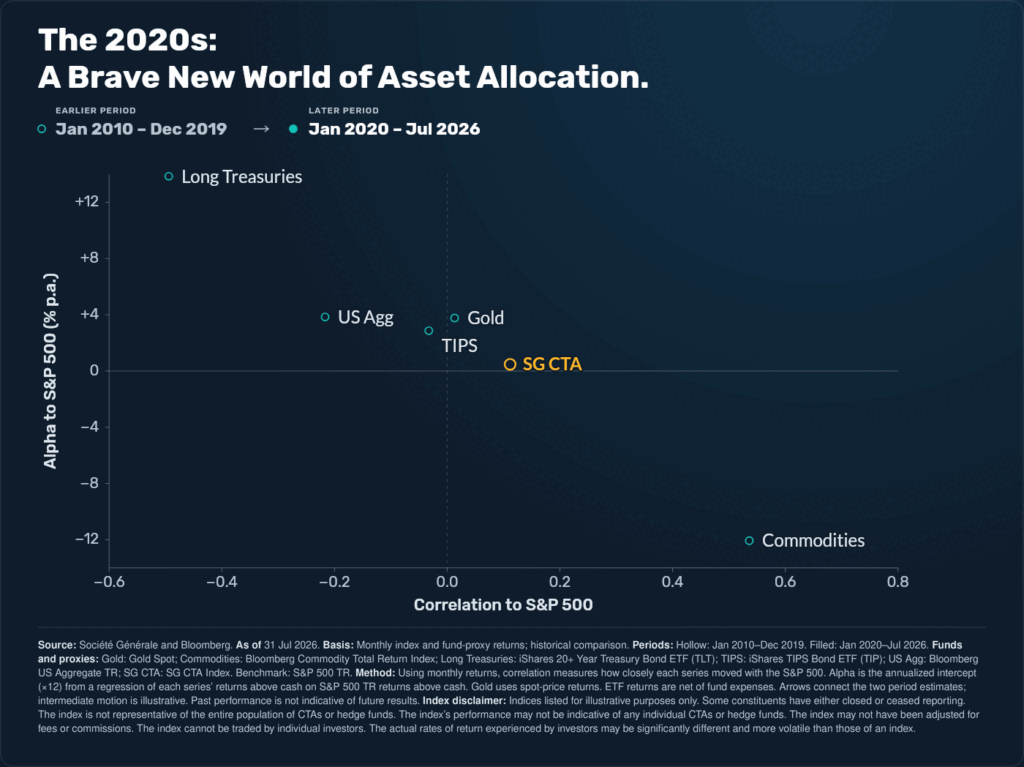
Every diversifier on this chart wants to live in the upper left: positive alpha with low or negative equity correlation. In the 2010s, Treasuries and core bonds benefited from a favorable environment, while managed futures already offered low equity correlation. With traditional diversification working relatively well, the case for a broader toolkit received less attention. […]