
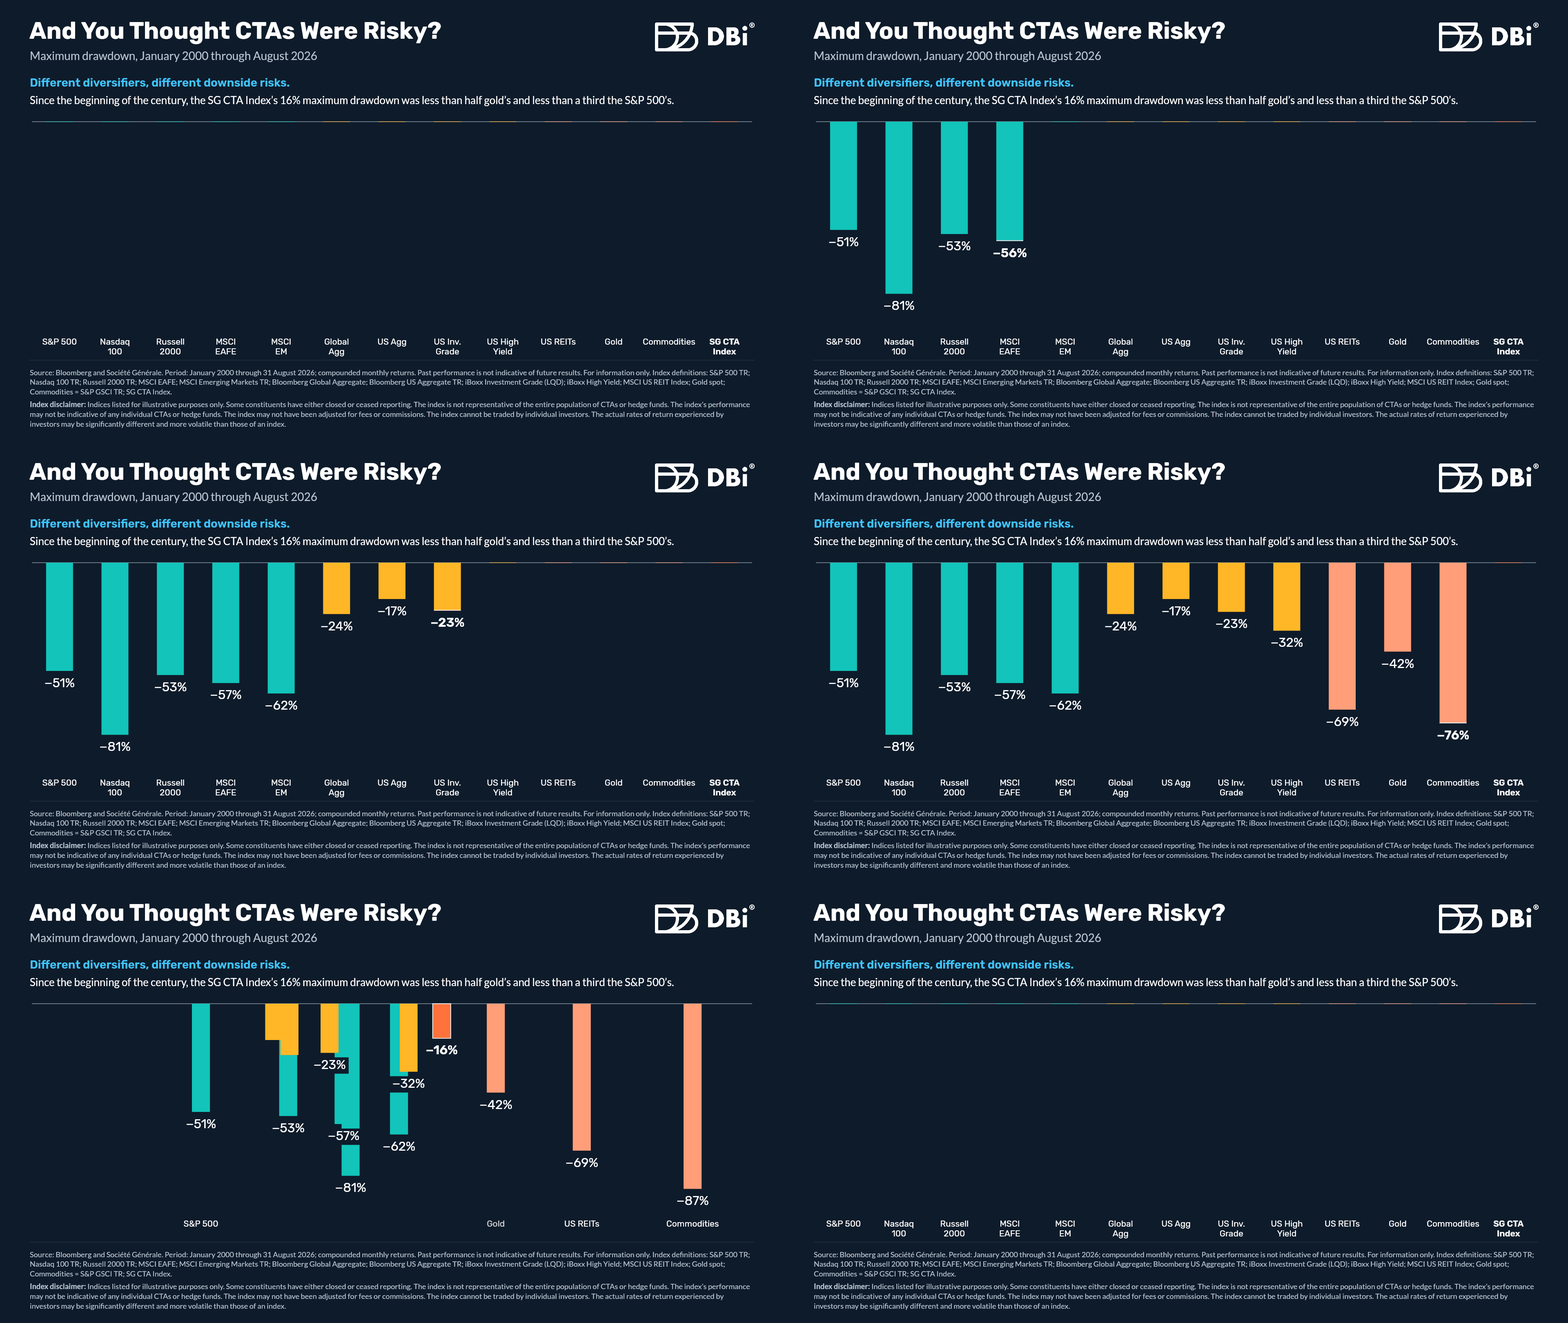
Since the SG CTA Index launched in 2000, its maximum drawdown has been smaller than that of the “safe” Bloomberg US Aggregate Bond Index.
It is also less than 40% of gold’s maximum drawdown, less than a third of the S&P 500’s, and less than 20% of broad commodities. That record covers more than 25 years.
Why the difference? Strategic asset allocation models tend to hold losing positions with a white-knuckle grip. They stayed long bonds as inflation came roaring back, long equities through the dot-com bust and the Global Financial Crisis, and long commodities as the Supercycle turned into a supply glut.
CTAs don’t. They take their losses, adjust, and move on, and the result has been shallower drawdowns.
One caveat: individual managers typically experience deeper drawdowns than the index, which makes diversifying across managers important.