Past performance is not indicative of future results. This presentation has been provided solely for informational or illustrative purposes and does not constitute an offer to buy or sell and of the securities or financial instruments contained herein, nor should it be construed as financial advice. All data contained herein has been obtained or derived from sources that we, DBi, believe to be accurate and reliable as of the date noted on the cover, but is not necessarily all-inclusive and there are no guarantees as to the accuracy or completeness. All data is likely to be superseded by subsequent market events or developments.
Material contained herein should not be treated as investment research or financial advice regarding any instrument, issuer, security or sector. Nor is it reflective of any portfolio, fund, vehicle, or strategy advised, sub-advised or managed by DBi. Nothing contained herein constitutes investment, legal, tax or other advice and should not be relied upon for investment decisions.
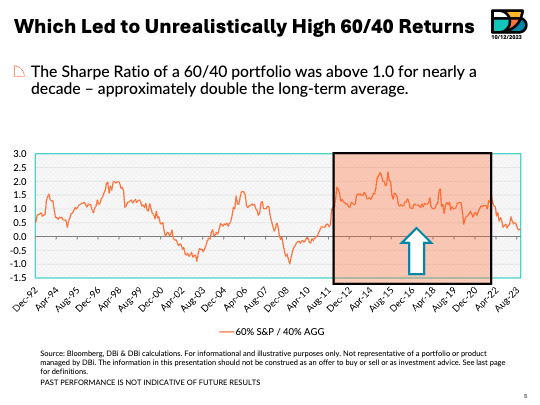
Definitions: 3yr Rolling CAGR – (Compounded Annual Growth Rate) -Refers to compounded annualized annual returns of a time series, utilizing monthly data, in continuous three-year windows.
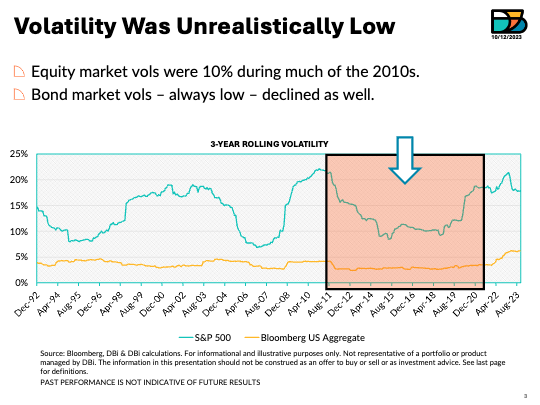
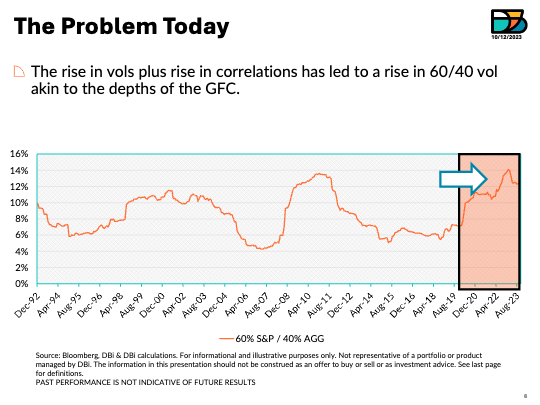
3yr Rolling Volatility – Refers to the annualized standard deviation of the time series, utilizing monthly data, in continuous three-year windows.
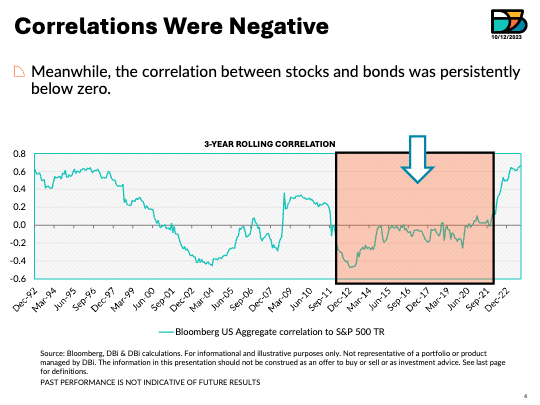
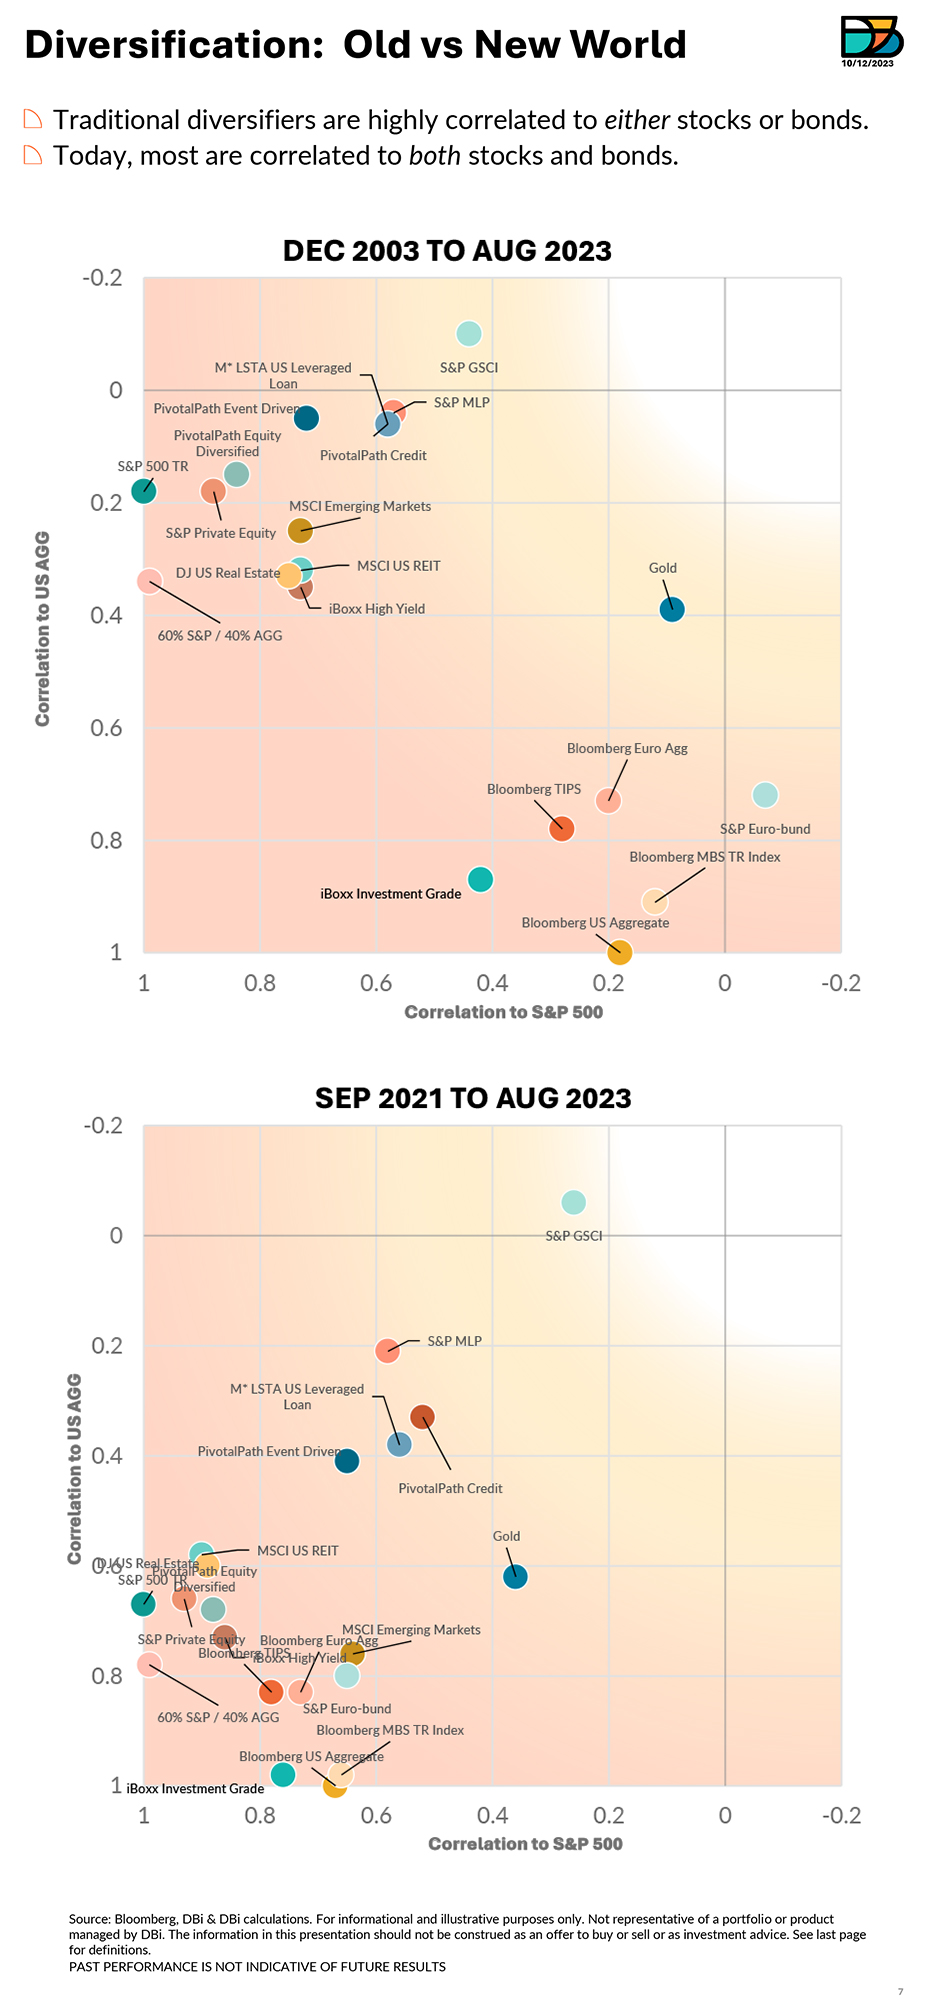
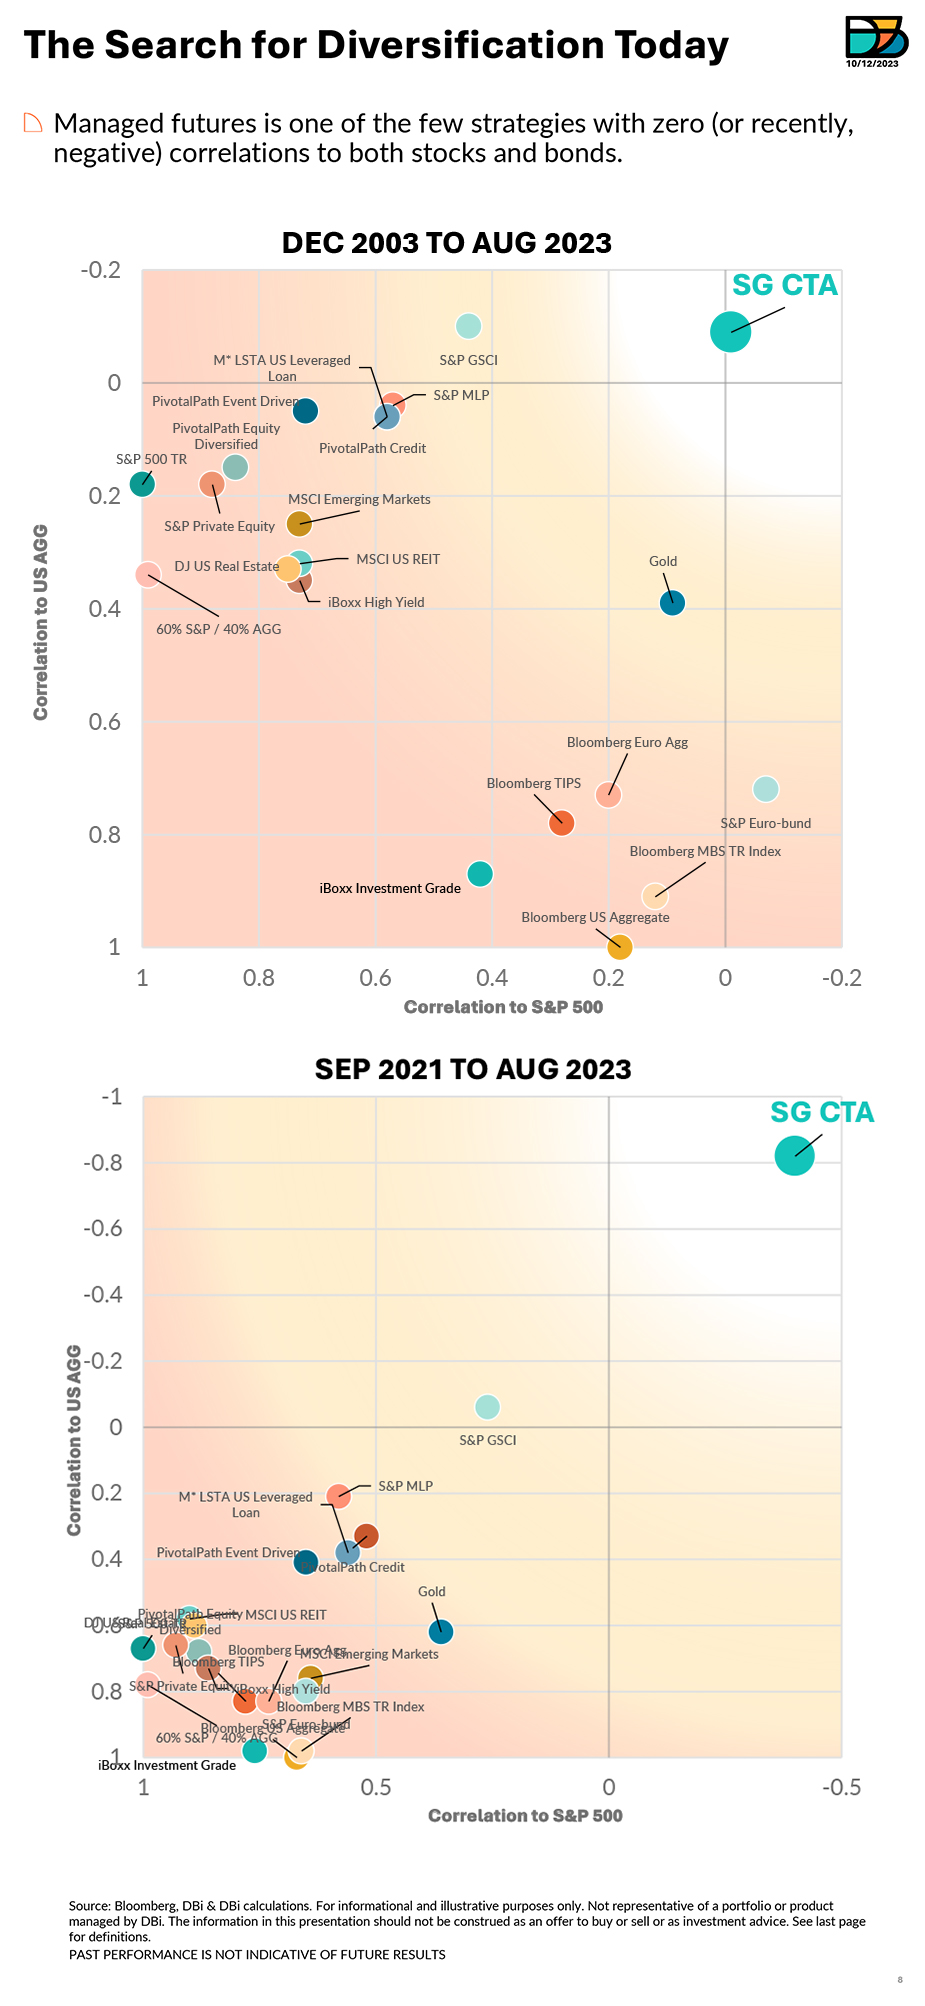
3yr Rolling Correlation – Refers to the degree in which the percentage change of the movement of two time series are related, utilizing monthly data in continuous three-year windows.